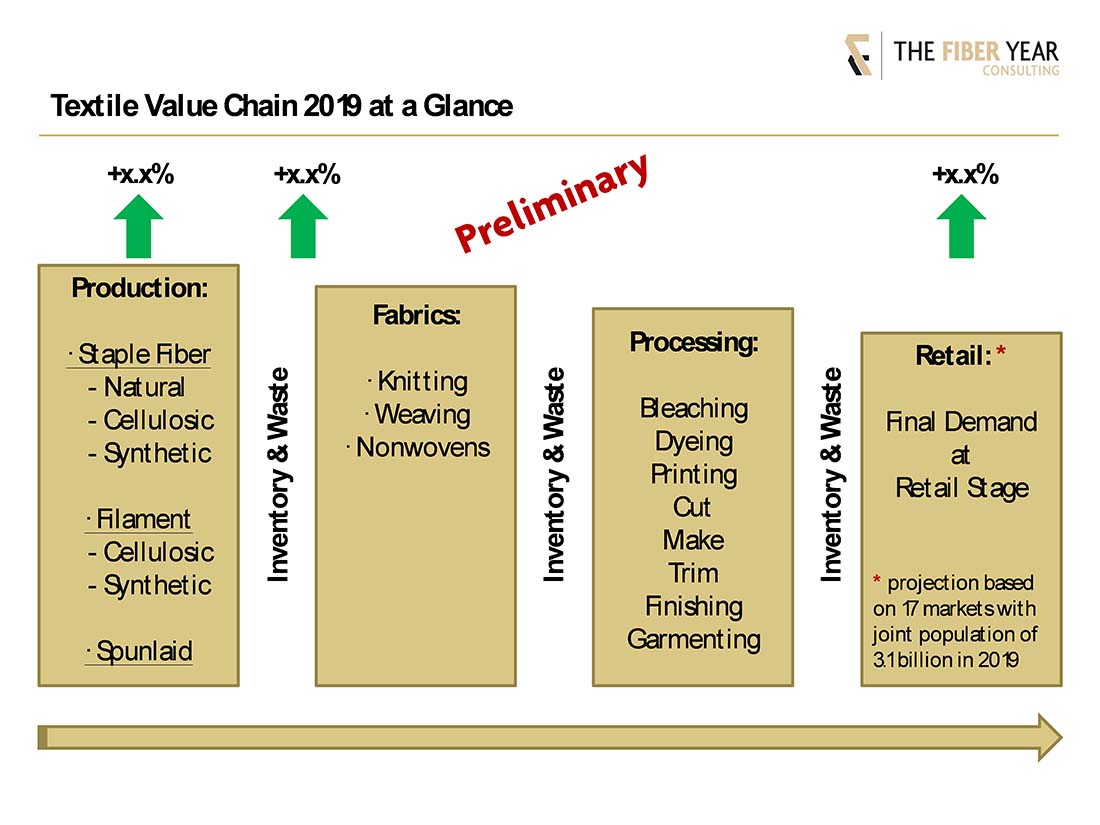
The 20th anniversary edition of The Fiber Year includes important improvements for participants along the value chain – a distinct differentiation between fiber supply and the volume entering textile processing. This refers to fiber inventory changes and delivers enhanced insights into processing volumes. A projection for last year‘s final end-use will enrich key figures along the textile value chain to illustrate different dynamics from supply to demand at retail stage. Secondly, the world supply has been expanded by spunlaid nonwovens that meet almost one kg per capita textile demand by now. This web-forming process skips a production stage as the polymer-based technology directly delivers a finished fabric. While we were planning to publish the latest edition of The Fiber Year in May, the COVID-19 pandemic forced a postponement, pushing publication of the report into June. The following report provides a taste for what you can expect.
Recent months were characterized by shifting production to urgently needed personal protective equipment, medical and hygiene articles, as the focus of our industry shifted to a direct response to COVID-19 pandemic, which will probably continue to affect our daily life into 2021. Slowing demand, however, had already become visible with the International Monetary Fund continuously lowering its 2019 growth projection from 3.5% (global growth) released in January 2019, to the 2.9% published one year later.
A deceleration of manufacturing activity and demand, with some industries like automotive already suffering from cutbacks in production in 2018, prompted a new view along the textile value chain.
Supply comprises natural fibers like cotton, wool, bast and other natural fibers with an average volume of 30 million tonnes between 2000 and 2018, with manmade fibers such as viscose, modal, lyocell, acetate tow, synthetic fibers (polyester, nylon, polypropylene and acrylic) and aramid, carbon as well as spandex fibers averaging at 51 million tonnes. In addition, spunlaid nonwovens have been integrated into the supply, and while they were not on the radar for fiber materials previously they meet nearly one kg per capita textile demand by now, mainly for hygiene articles.
The second key figure describes annual changes of the volume entering textile processing for mainly knitting, weaving, fiber-based nonwovens and unspun end-uses. It takes into account inventory changes from official sources. Global cotton data are split into production and use, whereas worldwide data for large-scale manmade fiber business are not available, which would help to increase transparency along the value chain.
Both figures are generally not synchronized; dynamics in supply have outperformed subsequent processing activity in eight years so far since 2000. Sometimes, opposing growth rates have been observed like in 2003 and 2016, with supply declining while downstream processing volumes continued growing.
Further down the line, the third key figure refers to final end-use at retail stage. A global view is impossible at this point of time, as trade figures are missing. The sample of 17 countries with a joint population of 3.1 billion last year includes lower, upper-middle and high income countries.
Handling of secondhand clothing articles (HS 6309) has been adjusted to the income category of countries. Imports of secondhand clothing articles are excluded for high income countries deriving from the thinking that consumers in such countries usually afford to buy new clothes. Exports of secondhand clothing articles are generally excluded, as they typically do not affect current textile consumption, rather the result of cleaning out the wardrobe, unless trade performance suggests significant trans-shipments.
Different bar sizes are the result of the gap between supply and demand volumes primarily arising from waste along the value chain for different processing technologies at various degrees. It is negligible at circular knitting and legwear, but may become quite substantial in flat and warp knitting, as well as along the weaving route.
Cut, make and trim operations further add to waste volumes, depending on the specific piece of garment. Finally, the destruction of unsold clothing items and the discarding of damaged articles from online returns scale up the waste volume.
Another condition affecting the global level arises from changes in manmade fiber inventories, as there is still no global data for main-stream fiber types like polyester, nylon and viscose. Expanded plant sizes and the transition from extruder spinning to continuous polymerization polyester plants have been attaching more relevance to this factor. (Major manufacturers are invited to share their data with The Fiber Year GmbH, which will be treated confidentially, to improve the level of accuracy in our reporting.)
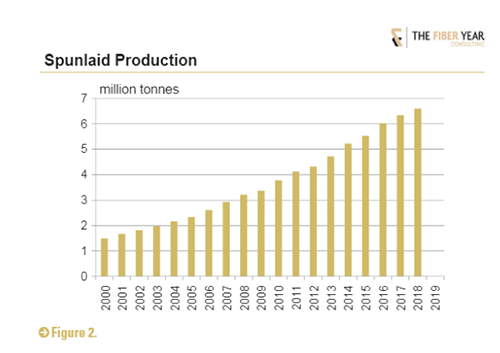
Spunlaid nonwovens expanded at an average rate of more than 8% in the century, adding around 5 million tonnes of polymer-based nonwovens since 2000. The process includes spunbond/SMS (spunbond/meltblown/spunbond) composites, meltblown and combinations of polymer-based material with pulp or staple fibers. Integrating this nonwovens type is important as polymers (mainly polypropylene and polyester) use corresponding feedstocks and is increasingly used in durable and disposable markets.
Please note the new office address as from mid-May: The Fiber Year GmbH, Käsereistrasse 13, CH-9306 Freidorf, located in picturesque landscape between St.Gallen and Lake Constance, just 70 minutes by train to Zurich airport.
The next installment of “The Fiber Year” column will provide global data and trends of The Fiber Year 2020 report, which is scheduled for publication in early June. For more information about The Fiber Year GmbH, visit thefiberyear.com.