Work for The Fiber Year 2023 still is in full swing but recognizable is a similar development to 2020 with natural fiber supply expanding and manmade fibers output shrinking. Declaring a pandemic in March 2020 has caught the world off guard just like the outbreak of the war in Ukraine in February last year. IMF world economic outlook projected economic growth of 4.4% in 2022 before Russia’s war of aggression and downgraded its projection to 3.4% a year later. The development of textile and apparel exports for major industries delivers an impactful reflection of slowing demand as well as worsening industry and consumer sentiment.
Cumulative Export Value Exceeding US$500 Billion
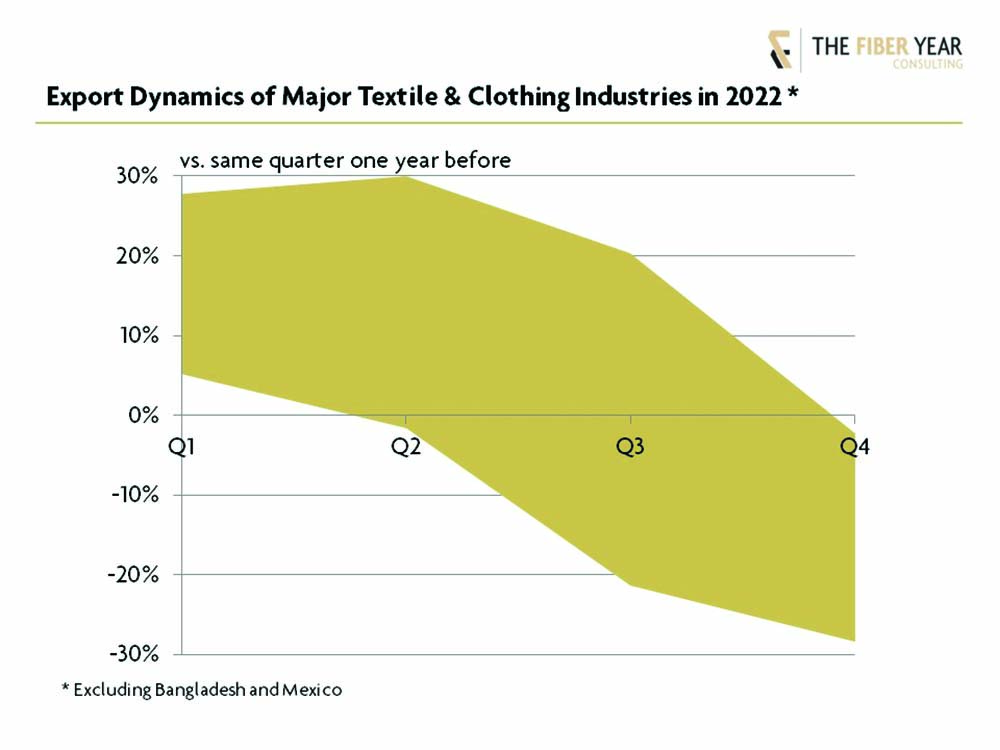
The chart includes export dynamics of a dozen Asian industries with a cumulative value worth US$520 billion, up almost 3% (see Fig. 1). This summary delivers quite a representative image of last year’s trend in demand. The next chart will specifically refer to Bangladesh and Mexico.
The first quarter was strong in both manufacturing and exports with all major industries recording significant gains ranging from 5% to 28% versus the same quarter a year ago.
The second quarter was characterized by weaker manufacturing and exports but still at a reasonable level with the Korean export industry first entering negative growth territory.
Third quarter did not bring recovery after a summer vacation everybody hoped for, but led to further slowing with negative export growth additionally from India, Indonesia and Türkiye despite Turkish CPI at 80% plus.
The final quarter was a disaster with rolling shutdowns of manufacturing units, further slowing retail sales and extended year-end holidays. The group of industries suffering from negative export growth can be enlarged by Cambodia, Malaysia, Pakistan, Sri Lanka, Taiwan, Thailand, Vietnam and China, partly due to the strict zero-COVID policy before it was lifted early December.
Steady Increases in Exports From Bangladesh and Mexico
Bangladesh and Mexico were the only top exporting industries with steady increases in quarterly shipments by value through the last year. Joint shipments, accounting for US$55 billion, expanded by 26% (see Fig. 2).
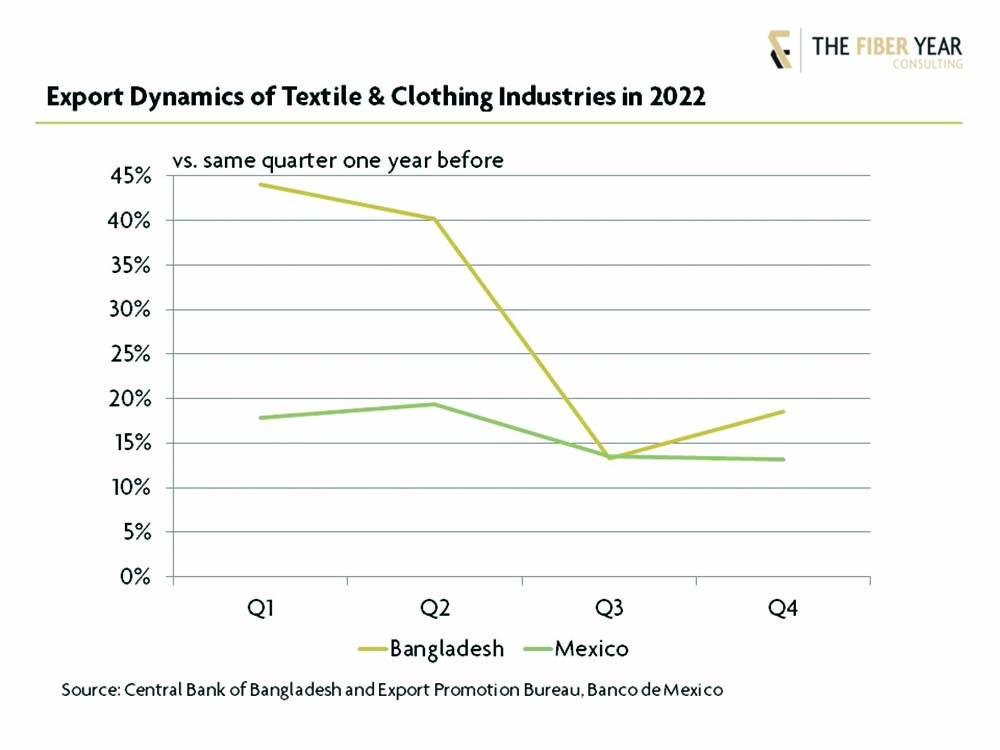
Bangladesh’s dynamics into the United States recorded the third-fastest growth rate among the top 10 suppliers and achieved into the European Union even the second position after surging deliveries from Myanmar. The comparison in value terms in times of high inflation runs the risk of distorting the real situation. Thus, to give an example, Bangladeshi shipments into EU soared 52% in local currency terms but just advanced 19% in volume terms thanks to faster expansion of woven garment articles than knitwear.
Mexican textile and primarily apparel industry benefited from near-shoring driven by the trade situation between the United States and China and from companies‘ need for reliable supply chains that facilitated openness for sourcing in Mexico and Central America as alternatives rather than depending entirely on the Chinese industry.
It is well enough known that the apparel business is extremely price-sensitive. It is like a traveling circus moving from one place with low wages to another with even lower wages. Hence, we cannot deny that everything is driven by pricing – leading to the crucial question of “how long will the region’s attractiveness last?”
Will regions’ appeal fade with normalcy returning to the global supply chain after shipping costs sharply fell already during last year, after the Chinese government lifted strict COVID-19 restrictions and after apparel makers aggressively offered steep discounts?
According to the National Council of Textile Organisations (NCTO), over US$1 billion of new textile and apparel investments have been announced in Central America and the United States over the last year. However, only time will tell whether the return to near-shoring and reduced movement of goods will remain in place. If so, it would additionally contribute to ambitious sustainability targets.
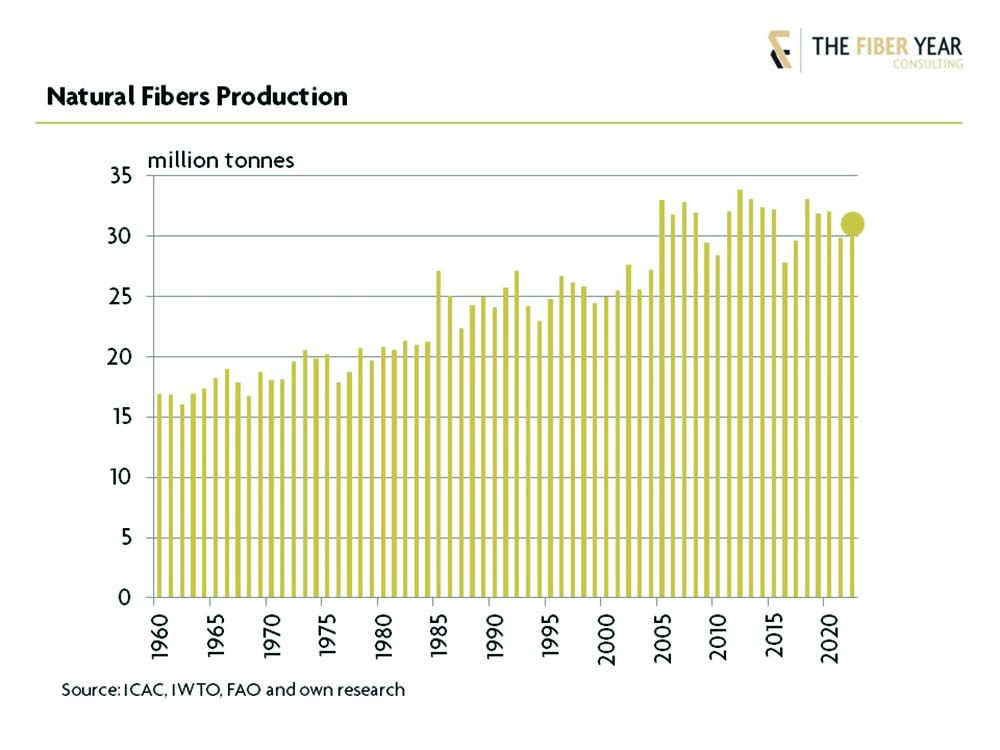
Natural Fiber Supply to Recover
The group of natural fibers is expected to have seen some growth last year, primarily driven by enlarged cotton harvesting. The cotton season ending July last year is projected to have lifted production by about 5% while use was tolerably stable. The sentiment in the current season running through July has clearly worsened with both production and use being a number of times downgraded with the latest projection revealing 3% reduced output and 10% lower use compared with last season. The lower production forecast was essentially affected by extreme weather events in Australia, Pakistan and the United States.
7th Decline of Manmade Fibers in 60 years
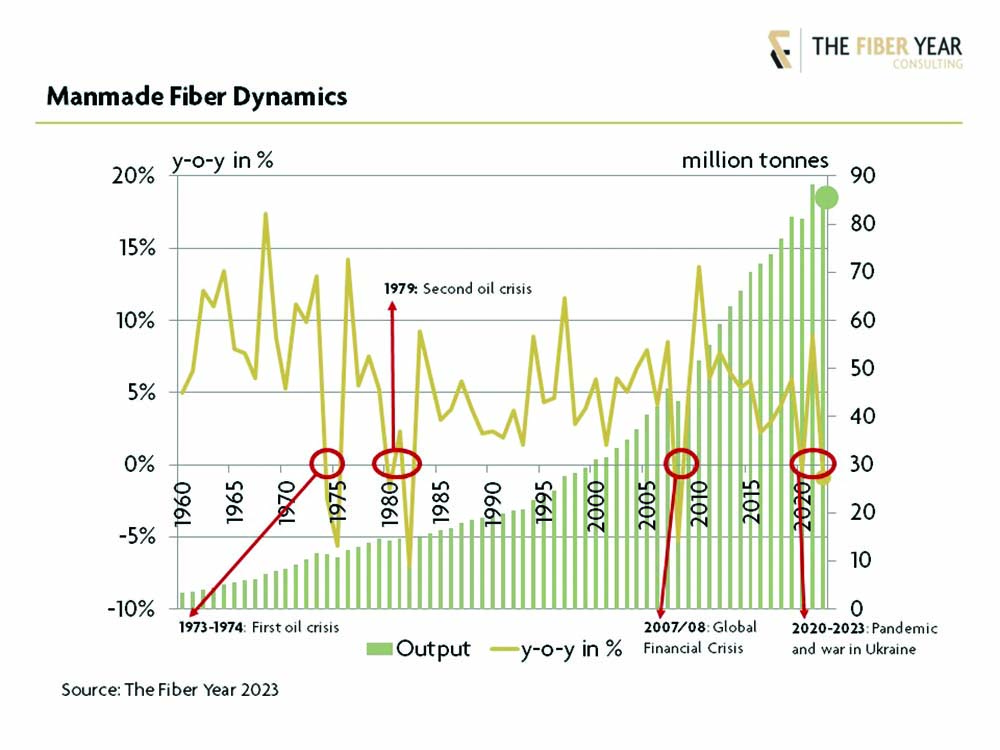
The chart shows more than 60 years of manmade fiber history, starting at a time when manmade fiber output was about 3 million tonnes with 80% cellulosics and synthetics still in its infancy with three-quarter of a million tonnes supply. Their share in the global fiber market amounted to around 15% before the breath-taking development brought them into the dominant position to occupy about three quarters of the world fiber supply by now. Nevertheless, the development was occasionally interrupted by negative growth in times of recession and oil price surge (see Fig. 3).
It started with the first oil crisis when OPEC proclaimed a six-month oil embargo and cut oil deliveries, which raised the oil price fourfold. Manmade fiber production fell in two years in a row by 2% in 1974 and by 6% the year after.
The second oil crisis was essentially caused by the Iranian Revolution in 1979 and resulted in the most severe post-war recession with the steepest contraction in manmade fiber production by -7%.
Manmade fiber output again entered negative growth territory during the global financial crisis and fell around 5% in 2008.
The manmade fiber industry was surprisingly strong when the once-in-a-hundred-years event – at least I hope so – hit the world after declaring a pandemic in March 2020. Output was just marginally sub-zero. However, it was a two-speed development with the Chinese industry lifting manufacturing while the rest of the world suffered from 10% contraction.
Not all data are yet confirmed for the previous year but it very much looks like another decrease with not even a handful of industries achieving positive growth. A slowing is expected for both wood-based cellulosics and oil-based synthetics, affecting all mainstream fiber types. Digging a bit deeper reveals expansions just in some smaller-scale sectors such as lyocell, aramid and carbon fibers.
Lyocell fibers benefit from outstanding wearing properties and perfectly match with global requirements for sustainability. Increase of aramid fibers was triggered by high demand in optical fiber cable markets, growing automotive consumption and increasing need for protective clothing (see Fig. 4). Carbon fibers were pushed by surging demand for wind energy, faster than expected improvement in air traffic, fleet replenishment and the launch of composite-rich freighters and business jets.
The full picture of latest market developments will be available in The Fiber Year 2023 from May, including a wealth of information from feedstocks to fibers, yarns, nonwovens and trade data.