COVID-19 is the macro event of our lifetimes, affecting the life and business of virtually everyone on the planet. For the global economy, the speed and depth of the pandemic’s effects represented an unprecedented shock.
Global impact
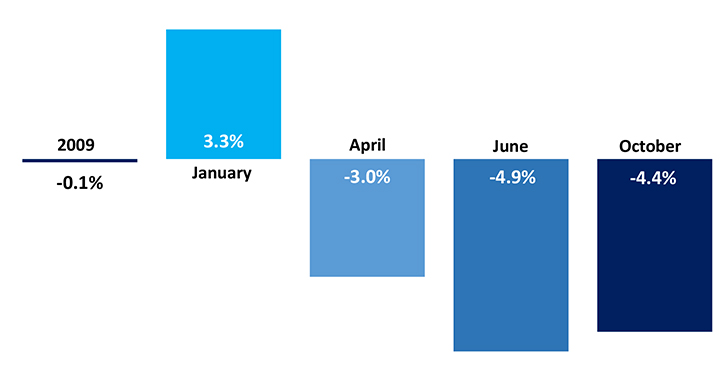
In their report released near the end of January, the International Monetary Fund was predicting 2020 would be a year of accelerated growth relative to 2019 (from +2.9% real GDP growth in 2019 to +3.3% in 2020). A primary reason cited for the expectations of improved growth was progress in the U.S.-China trade dispute. The Phase One agreement had just been signed, and it appeared that further escalation in tariffs between the world’s two largest economies had been put on hold (IMF, World Economic Outlook).
Although it had already made an appearance in China, the January IMF report did not mention COVID-19. By the time of the IMF’s April set of revisions, the virus was the dominant factor and the IMF was calling for the deepest contraction in decades (-3.0%). By its June update, the IMF estimated that 2020 would experience the biggest decline in world GDP since the Great Depression (-4.9%). For comparison, in 2009, the worst year following the financial crisis, the global economy barely contracted (-0.1%).
A reason that the contraction in 2009 was not more severe is that when a given country, or collection of countries, fall into recession, there commonly are other countries that are still growing. At the world-level, growth in non-recessionary markets can offset the negative influences of others. This is less the case in 2020, when the entire world has had to take precautionary measures with the pandemic.
The speed that the globe transitioned from expectations of accelerated growth to shutdown had sharp repercussions across industries. On top of rocketing unemployment and the shock to consumer confidence, it was simply not possible to shop at many traditional channels, and consumer spending suffered.
Apparel demand
For fiber markets, the largest source of downstream demand is apparel. In shutdown periods, devoted brick-and-mortar clothing stores were generally unable to secure essential labels and were shuttered. With these businesses closed and with consumers encouraged to stay home, the declines in apparel spending were record-setting.
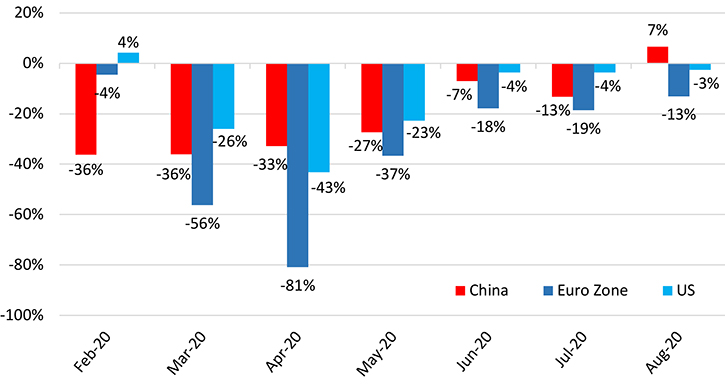
In China, official figures indicate that clothing sales dropped to -36% year-over-year in February and March. This is a huge reversal relative to growth rates near +10% that were common ahead of COVID. In other major apparel consumption markets, declines were steeper (China, National Bureau of Statistics). In Europe, retail turnover for textiles and apparel plummeted as low as -81% year-over-year (in April, Eurostat). In the U.S., consumer spending on clothing bottomed out at -43% (in April, US Bureau of Economic Analysis).
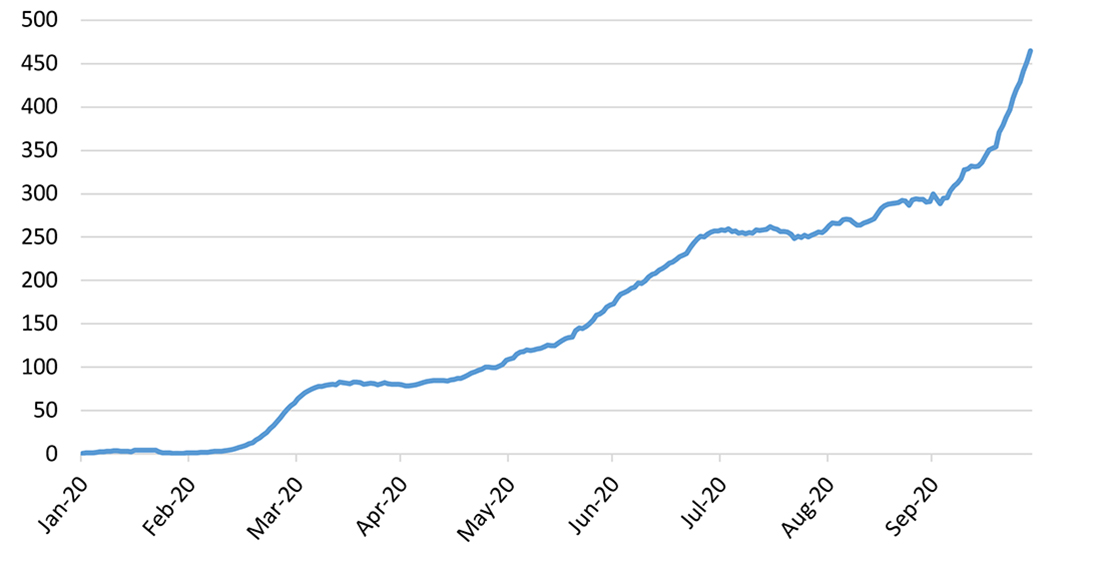
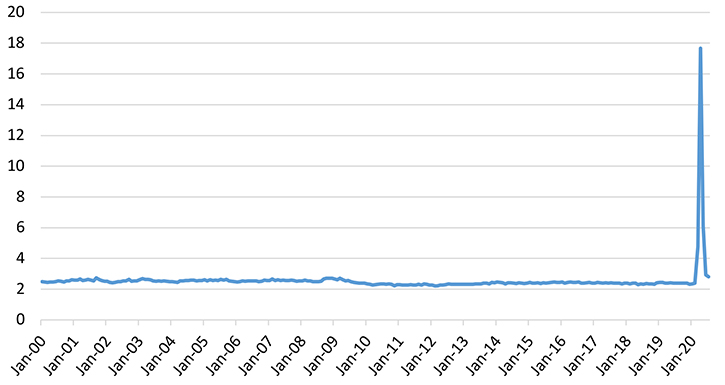
The rapid onset of COVID-19 and the closures it caused meant that many retailers had product prepared for the spring when the pandemic hit. When sales dropped off, it implied a massive accumulation of inventory. In the U.S., the Census Bureau publishes an inventory-to-sales ratio for clothing stores. Prior to the pandemic, that ratio had been consistently near levels around 2.4. In April, the ratio climbed to a level more than 7 times that high (17.7). There has been improvement since, but the ratio is still about 20% higher than it was before the virus (U.S. Census, Manufacturing & Trade Inventories & Sales).
There is no guarantee that apparel items bought for the 2020 spring season may still be in fashion next year, and it costs money to warehouse garments. To help alleviate costs, many retailers resorted to discounting. There were record month-over-month decreases in the CPI for apparel spending in the spring (-4.7% in April and down another -2.7% in May). Clothing has not been a category with a significant inflation in recent decades, but a cumulative effect of this discounting was that U.S. clothing prices dropped to their lowest levels since the late 1980s (U.S. Bureau of Labor Statistics, Consumer Price Index).
The combination of lower sales volume and lower prices have been a dual threat to retailer profitability. Not only are apparel merchants selling fewer items, but per unit margins are lower. This explains why there have been many apparel retailers that have gone into bankruptcy. It also explains why retailers been aggressive in cutting costs.
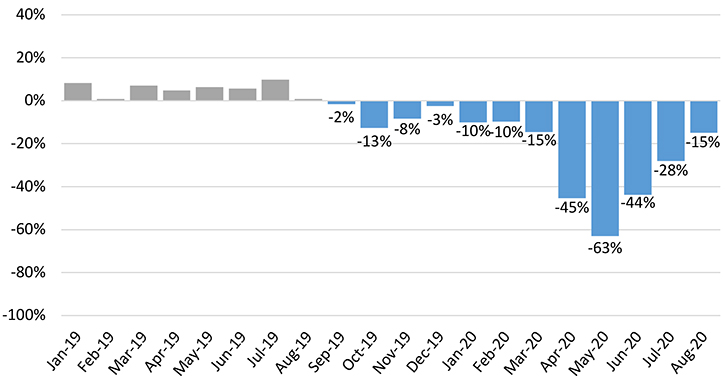
For apparel retailers, a major cost are the garments they sell, and a common strategy post-COVID was to delay or cancel orders. In the U.S., the vast majority of apparel is imported, and import data can be used to track retailer demand. In terms or weight volume, retailer imports were down between -44% and -63% from April to June.
While this discussion has been focused on the U.S., parallel strategies can be assumed to have been applied around the world. Lower apparel demand implies lower fiber demand.
Fiber demand & prices
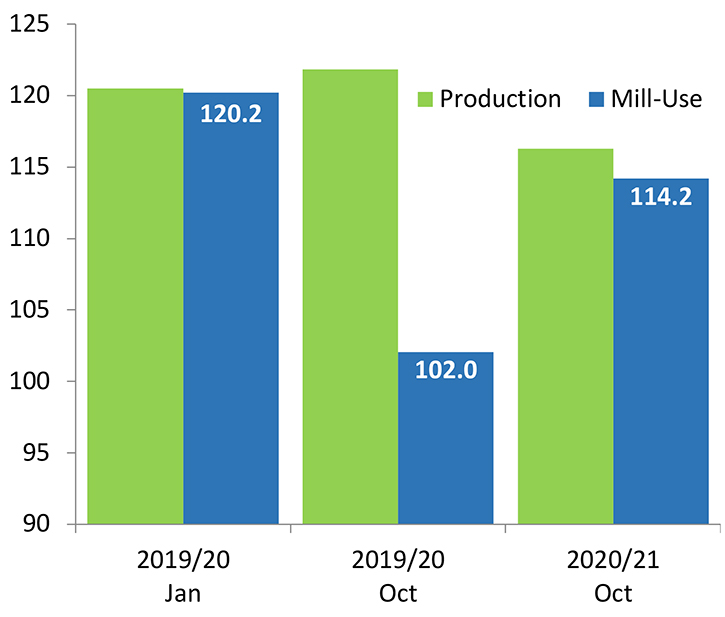
With COVID, the USDA made record cuts to its forecasts for world mill-use (USDA WASDE). In January, the USDA was predicting that the global harvest and global offtake would be balanced (120.5 million bales of production and 120.2 million bales of mill-use). The current estimate for global consumption in the 2019/20 crop year (ran from August 2019 through July 2020) is 15% lower than it was in January.
Correspondingly, the drop in mill-use caused a significant surplus. That surplus ranks as the second-largest on record (18.1 million bales). Since cotton can be stored through time, this means that there is a lot of warehoused supply available that should be a feature of the market for years to come.
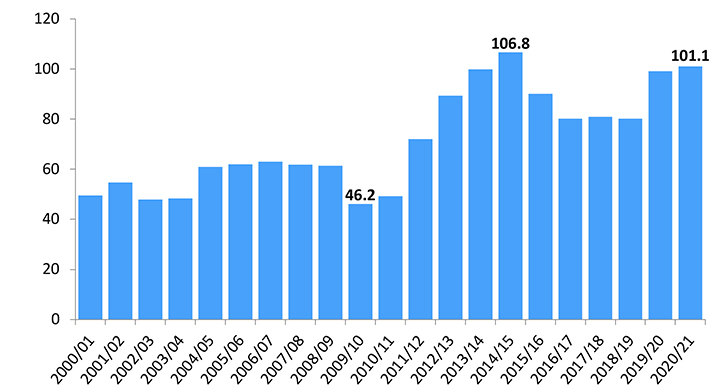
This is a much different situation than what the cotton market faced when it was coming out of the last recession. Ahead of the financial crisis, growers around the world had been shifting away from cotton due to low prices. When demand resurfaced with the economic recovery, cotton was not in the fields and was not in storage. This fed into the 2010/11 price spike.
A much different situation currently exists. At the end of the 2020/21 crop year (August 2020-July 2021), the world is expected to have the second highest volume of cotton stocks on record. The level of stocks near 100 million bales is more than twice the amount held in 2009/10 and 2010/11 and suggests that the likelihood of another price spike is remote.
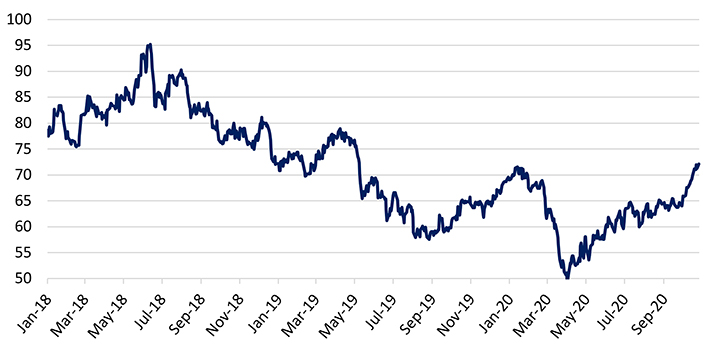
The presence of so much supply also raises the question of how prices have been able to manage the increases registered in recent months. Despite record daily global case rates for COVID, which suggests the possibility of renewed lockdown orders and renewed threats to global economic growth, cotton prices are above levels from one year ago when COVID had not even begun to spread.
There have been weather-related challenges to 2020/21 production. This has been especially true for the U.S., where there has been a series of hurricanes and very hot and dry conditions were prevalent in the important region of West Texas.
Other factors that may also be contributing to the strength of cotton prices include the recent upward revisions to estimates for global economic growth. Relative to the figures from June, the IMF lifted their forecast for 2020 from -4.9% to -4.4% in October. Economic growth is one of the better predictors for change in fiber demand, and the USDA has made upward revisions for its global consumption forecast for 2020/21 in October.
Phase One
Beyond the macroeconomic situation, developments in international trade may also be supporting prices. Despite COVID, the U.S. was able to manage higher export sales that were higher than year-ago levels throughout the spring and summer. With COVID, a reason that export sales were higher had to do with strong purchasing from China. Between April and the present, China represented nearly 60% of all U.S. export sales. During the entire 2019/20 crop year, China represented only 17% of U.S. exports (USDA FAS).
A reason that China accelerated its purchases of U.S. cotton is the Phase One deal signed in January. The Phase One deal has been interpreted as an end to the successive rounds of tariff escalation that occurred since July 2018. The 25-percentage point increase in Chinese tariffs on U.S. cotton, which have been in effect since July 2018, had been detrimental to U.S. export sales to China since their implementation.
In the spring, when much of the world was in lockdown and downstream demand was uncertain, the Chinese government stepped in to buy U.S. cotton for its reserve system. This bypassed the issue of tariffs on U.S. fiber and allowed the Chinese government to build up its supplies of quality cotton at lower prices.
No commitments specific to cotton were made public, but a commitment relative to U.S. agriculture overall was announced. The agreement stated that China would buy $12.5 billion more of U.S. agricultural goods in 2020 than it did in 2017. Trade data can be tracked, and the value of goods that China has imported from the U.S. through September (latest available) is less than half the amount required to be on pace to meet the amount set by the deal (Peterson Institute of International Economics, U.S.-China Phase One Tracker: China’s Purchases of U.S. Goods).
The Office of the Trade Representative (USTR) and the USDA issued a joint report in late October, which specified that the ag-related target in the Phase One agreement would be applied to the twelve months that followed implementation (February 14th, 2020). Merchants trading U.S. agricultural commodities are required to report weekly sales and shipments data to the USDA. Using those data, the report indicated that 70% of the transactions required by Phase One had been made by October (USTR and USDA, Interim. Report on the Economic and Trade Agreement between the United States of America and the People’s Republic of China).
Sales can be rolled forward or cancelled, so there is a degree of uncertainty surrounding those numbers. Whether or not there will be concessions made for COVID-19 is also unknown. What appears more certain is that the Phase One deal will represent an on-going political issue for both countries in 2021 and beyond.
Trade tensions beyond Phase One
The signing of the Phase One deal brought changes to U.S. tariffs on Chinese-made apparel. In September 2019, the U.S. began applying a supplemental 15 percentage point increase on garments imported from China. In February, as the Phase One deal became active, those tariff increases were reduced by half (to a 7.5 percentage point increase relative to where they were before September 2019).
There is less reliance on China for cotton-dominant garments than there is for manmade items, but China is the largest sourcing location for U.S. apparel importers. Before the supplemental tariffs, U.S. importers were buying from China because they found it to be the most profitable option for the goods they were sourcing.
When tariffs were implemented, it affected retailer profitability. Along with difficulty in finding alternate locations, a net effect was a decrease in order volume across the board. In the months after tariffs and before COVID, the weight volume of U.S. apparel imports (all fiber content) was down 8% year-over-year. The percentage change in imports from all locations were similar in magnitude for both cotton and non-cotton garments. For global cotton consumption, the reduction in U.S. order placement represented the loss of more than one million bales of demand.
Summary & outlook
The recent surge in COVID cases in Europe and the U.S. has prompted renewed restrictions on consumer activity. This presents a renewed threat to economic activity and demand throughout supply chains.
Considerable uncertainty surrounds the U.S.-China trade dispute. The election may change the way the U.S. implements new policies, but indications are that tariffs and a global trend towards managed (as opposed to free) trade will continue. The interjection of policy on top of supply and demand clouds the price outlook for cotton. Nonetheless, the existence of so much global warehoused supply make sustained upward movement in cotton prices appear unlikely.
References
1. Eurostat, https://ec.europa.eu/eurostat/data/database
2. International Monetary Fund (IMF), World Economic Outlook, https://www.imf.org/en/Publications/WEO
3. National Bureau of Statistics of China, http://www.stats.gov.cn/english/
4. Peterson Institute of International Economics, “US-China Phase One Tracker: China’s Purchases of US Goods”, https://www.piie.com/research/piie-charts/us-china-phase-one-tracker-chinas-purchases-us-goods
5. US Bureau of Labor Statistics, Consumer Price Index, https://www.bls.gov/cpi/
6. US Census Bureau, Manufacturing & Trade Inventories & Sales, https://www.census.gov/mtis/index.html
7. US Census Bureau, USA Trade Online, https://usatrade.census.gov/
8. US Department of Commerce, Office of Textiles and Apparel (OTEXA), http://www.otexa.gov
9. USDA, Foreign Agricultural Service (FAS), http://apps.fas.usda.gov
10. USDA, World Agricultural Supply & Demand Estimates (WASDE), https://www.usda.gov/oce/commodity/wasde