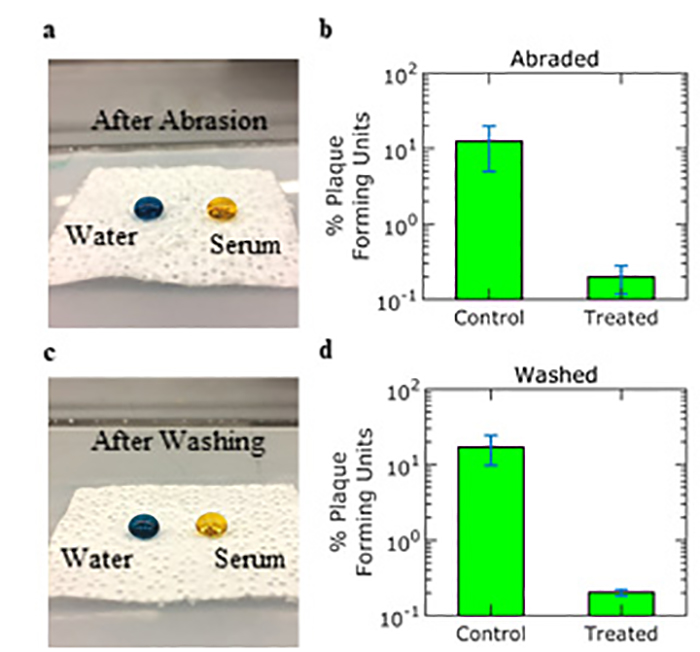
Figure 2. a) Treated textile sample after 100,000 scrub abrasion cycles with water and serum liquid droplets b) Percent plaque forming units of adenovirus type 4a on abraded control and treated textiles c) Treated textile sample after 12 ultrasonic washing cycles with water and serum liquid droplets d) Percent plaque forming units of adenovirus type 4a on washed control and treated textiles.
IFJ_04-2020_studentspotlight_Figure2