
Ongoing deceleration of economic growth has been increasingly affecting textile businesses and final end-use at retail stage. Responding to this trend, The Fiber Year GmbH has developed a new report, Textiles 2025, which projects market sizes and per capita consumption for 173 countries. Market sizes provide the basis for formula-based predictions using demographics, national GDP growth rates and projected income changes with different weighting, depending on the income category, to arrive at likely 2025 textile market projections. The scope of countries considered in the report varies from high income nations to the group of Least Developed Countries (LDC), with corresponding data for 2018 and 2025 in income-divided tables.
World economic outlook projections from the International Monetary Fund (IMF) have been steadily adjusted downwards from mid-2018 after the U.S. administration imposed sweeping tariffs on China in July 2018. Consumer confidence in the 36 OECD (Organisation for Economic Cooperation and Development) countries gradually worsened likewise, despite a recovery in the final quarter of 2019, which is expected to reverse following additional uncertainty from the global coronavirus pandemic. Let‘s hope and pray for all infected patients to recover and for China and all affected countries to overcome the coronavirus outbreak rapidly.
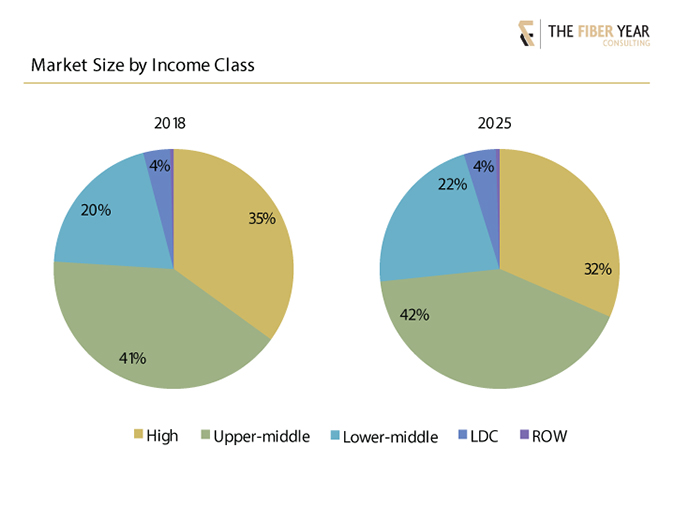
The 52-nation high income class of countries comprise 1.2 billion people, who consume 35% of textiles in 2018. The 2025 share of these countries is projected to decline by 3.5 percentage points, as stimulus from demographics is weak with just 35 million new consumers.
Meanwhile, the upper-middle income countries are expected to raise their share to 42%. And stronger population growth is anticipated for the lower-middle income group of currently 26 countries, which figures to drive the market upward in this category as well.
LDCs, including Syria and Tajikistan, are predicted to witness the fastest relative growth rates in population, adding 180 million consumers, and textile market size. However, the effect in absolute terms is marginal due to an average per capita consumption of around 4 kg, which in many cases is being met by significant volumes of used clothing imports.
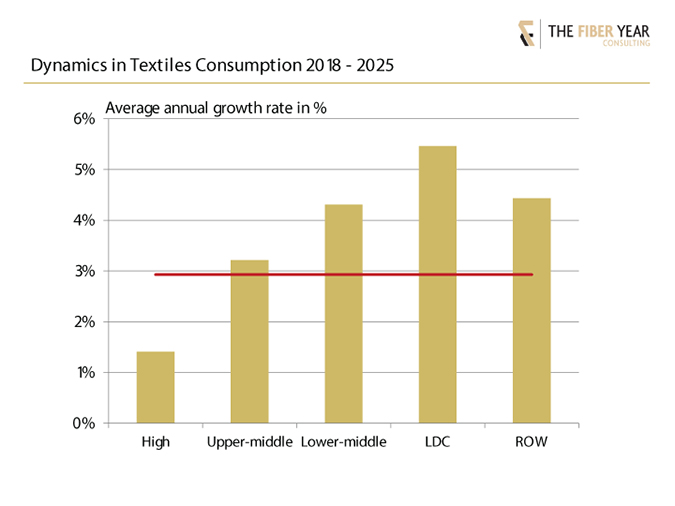
Dynamics in textile demand accelerate with descending income. The major growth driver is expected to be the group of upper-middle income countries, as they are projected to raise their joint textile consumption by about 10 million tonnes followed by lower-middle income nations lifting their future volume by almost 7 million tonnes.
The current average per capita demand varies quite significantly in the high-income category, ranging from 22 kg for countries with gross national income between U.S. $14,000 and U.S. $25,000 to the group of richest nations, with 37 kg textile consumption. Wealthy nations represent a market size of 15 million tonnes that is expected to witness above-average annual growth at 1.7% to exceed 17 million tonnes by 2025.
Rest of the world (ROW), including North Korea due to insufficient data quality and small vacation islands with joint population of about 45 million, was estimated to arrive at a global picture.
A detailed look into 25 selected countries shows historic market size and per capita consumption between 2005 and 2018, plus a projection for 2025 as exemplified for the United States. The U.S. market size is anticipated to grow from 12.9 million tonnes to 14.6 million tonnes by 2025, equal to a per capita consumption exceeding 42 kg.
The following chart reveals the new approach for handling of secondhand clothing trade (trade code 6309) that has been adjusted to the income category of countries. Imports of secondhand clothing articles are excluded for high income countries based on the thinking that consumers in such countries usually can afford to buy new clothes. Exports of secondhand clothing articles are generally excluded, as they typically do not affect current textile consumption, rather the result of wardrobe cleanouts, unless trade performance suggests significant transshipments.

As a general rule, high income countries are net exporters of worn clothing. Hence, this new definition results in higher per capita demand as before. Contrary, Canada and Slovakia are high-income nations with a permanent import surplus. General notion for this exception is that a considerable portion of such import volumes turns out to be not resalable and will not be used for local consumption.
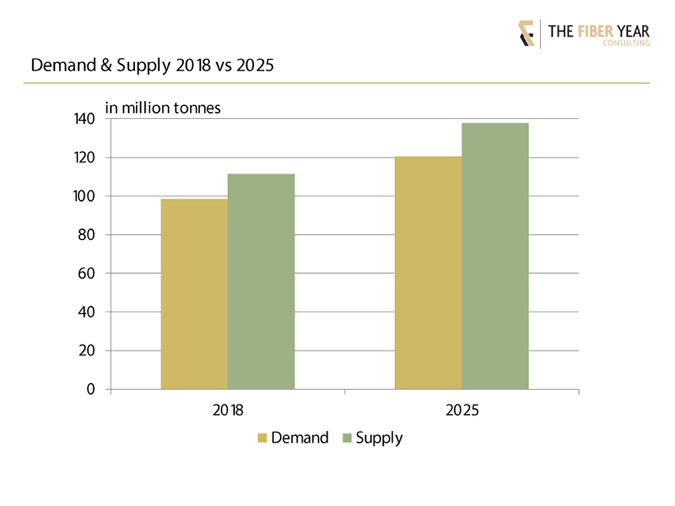
Demand projection for 2025 at global stage accounts for 120.5 million tonnes derived from formula-based predictions using demographics, national GDP growth rates and projected income changes with different weighting depending on the income category. This volume comprises natural and manmade fibers together with spunlaid nonwovens that account for almost 1 kg per head textile demand by now.
The growth projection translates into an average annual growth rate of about 3% that is similar to the likely expansion of supply, understood as fiber and spunlaid output, to arrive at 137.7 million tonnes. The gap between supply and demand volumes primarily arises from waste along the value chain for different processing technologies at various degrees. Cut, make and trim operations further add to waste volumes depending on the specific piece of garment. Finally, destruction of unsold clothing items and discarding of damaged articles from online returns scale up waste volumes.
Several key figures from major trading countries, worsening confidence indexes and drastic setbacks in both passenger car production and sales indicate a below-average consumption growth in 2019. The early 2020 outbreak of coronavirus, a potentially devastating pandemic, with deceleration of industrial production, disturbance of global trade flows, disruption of international supply chains and restrictions in international traveling will affect all markets worldwide. The unpredictable course of the disease will have a dramatic impact on this year’s demand. Nevertheless, the textile business remains a growth model in the long run and the latest slump during financial crisis was followed by above-average backlog demand, which appears realistic after the coronavirus is overcome globally.
This article is based on new material abstracted from Textiles 2025, which projects future textile consumption levels based on the analysis of 125 countries with in-depth analysis from 2005 for 70 countries across all income categories, while 55 nations were exclusively put under the microscope for 2018. Ten out of 47 least developed countries (LDCs) according to United Nations, expanded by Syria and Tajikistan, were analyzed in detail, and the remaining 2018 demand levels are estimated according to income level. A table of contents is available at https://thefiberyear.com/home/.
The next installment of “The Fiber Year” column will provide a preview of The Fiber Year 2020 report, which is scheduled for publication in early May.