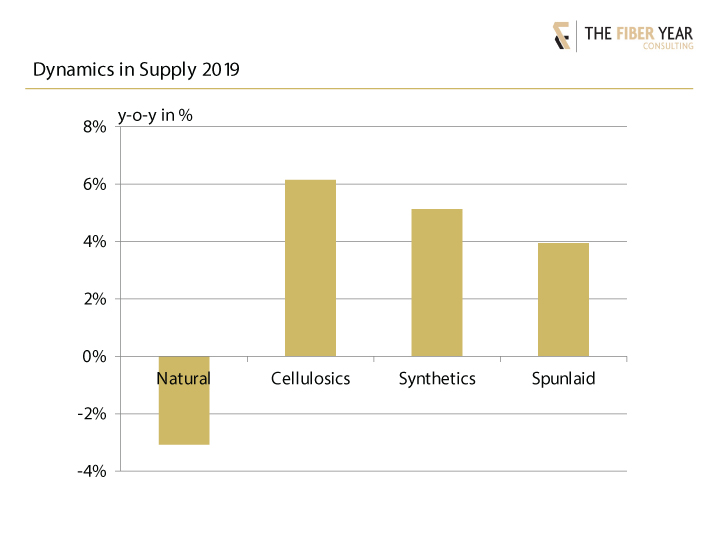
The 20th anniversary issue of The Fiber Year shows deceleration along the textile chain from world supply to processing volumes and finally consumption at retail stage. The enhanced view illustrates different dynamics from global supply growing almost 3% to final end-use advancing 2%. Output of natural fibers fell 3%, while manmade cellulosic fibers continued to outperform the market growing more than 6%, and synthetics, predominantly polyester, advanced 5%. In addition, supply was enlarged by spunlaid nonwovens that meet nearly one kg per capita textile demand by now, however they slowed to the lowest growth rate in the century at almost 4%.
World economic growth recorded its slowest pace since the financial crisis a decade ago following intensifying trade uncertainties and barriers, slowdown in major economies and geopolitical tensions that weighed on business sentiment and resulted in deceleration of machinery investments and household consumption.
Adverse business conditions affected the global textile industry, and the entire textile value chain suffered from significant deceleration last year before a dramatic contraction began after the coronavirus outbreak.
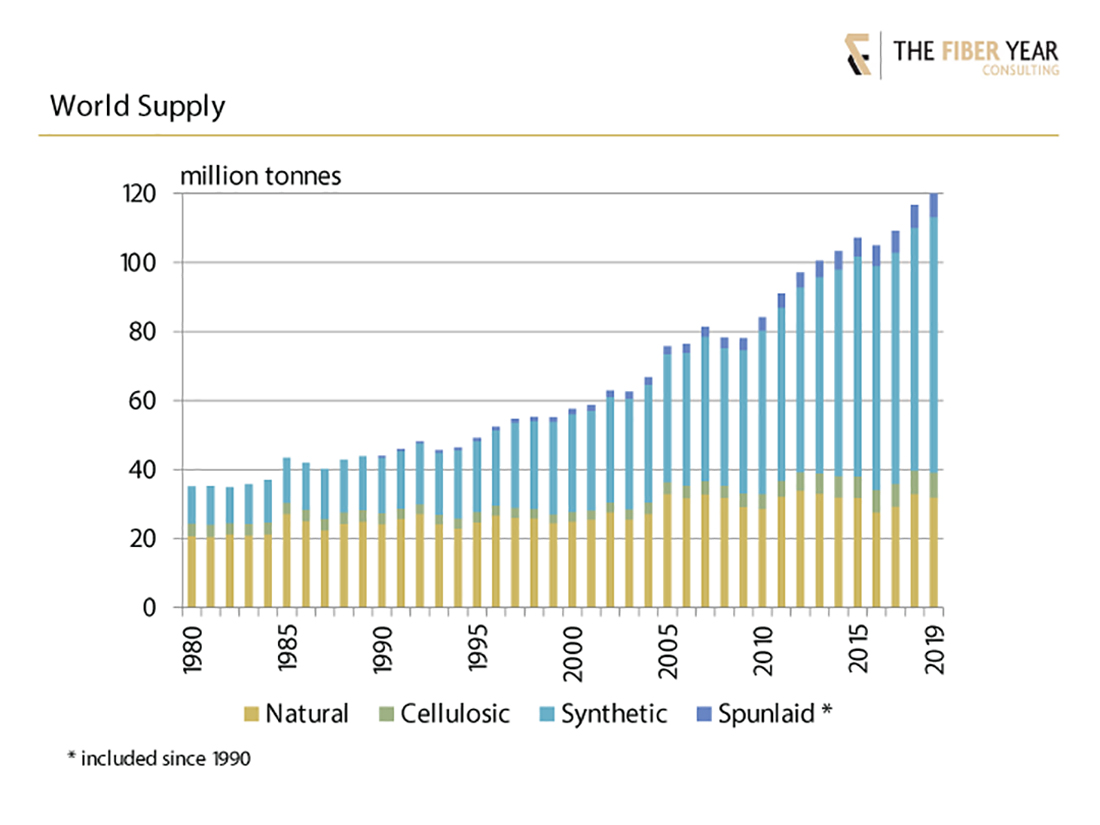
While supply from natural fibers were growing, manmade fiber and spunlaid production slowed to less than 3% growth from almost 7% expansion in the year before. Total volume accounted for 120 million tonnes, which translates into an average consumption of almost 16 kg per capita.
Cultivation of natural fibers decreased 3% to 32 million tonnes with cotton output after two-year growth falling faster to 26 million tonnes, wool softening nearly 1%, bast fibers projected to have grown by 1%, while other natural fibers were relatively stable.
Manmade cellulosic fibers continued their dynamic growth, expanding more than 6% to 7 million tonnes. Viscose staple fibers including modal and lyocell accelerated 8%, while filaments saw a modest decline and acetate tow modest growth.
Synthetics achieved 5% growth thanks to robust expansion of polyester filaments and staple fibers, whereas nylon slightly rose and both acrylic and polypropylene fibers weakened. Their total volume amounted to 74 million tonnes.
Spunlaid nonwovens, newly included in the global supply, slowed to the lowest growth rate in the century at nearly 4% to almost 7 million tonnes.
Last year’s dynamics in the four market segments revealed quite different results. The performance in 2019 was characterized by output of natural fibers falling 3%, which was the tenth yearly decline in the century. It was predominantly caused by reduced cotton production in the 2018/19 season after double-digit gain the prior season. The entire manmade cellulosic fibers business continued to outperform the market after growing more than 6% and synthetics, predominantly polyester, advanced 5%. Spunlaid nonwovens slowed to the lowest growth rate in the century at nearly 4%, which was less than half the average annual growth rate in the century.
The introduction of three key figures along the textile chain illustrates different dynamics. Global supply decelerated from almost 7% growth in 2018 to 2.8% with manmade fibers further enlarging their share to 68%.
The second key figure describes annual changes of the volume entering textile processing for mainly knitting, weaving, fiber-based nonwovens and unspun end-uses. It takes into account inventory changes from official sources. Global cotton data are split into production and use, whereas worldwide data for the large-scale manmade fiber business are not available, which would help to increase transparency along the value chain. Expanded plant sizes and the transition from extruder spinning to continuous polymerization polyester plants, in particular, are believed to attach more relevance to this factor. The volume change of materials entering processing grew, but met another steep slowdown from nearly 5% a year ago.
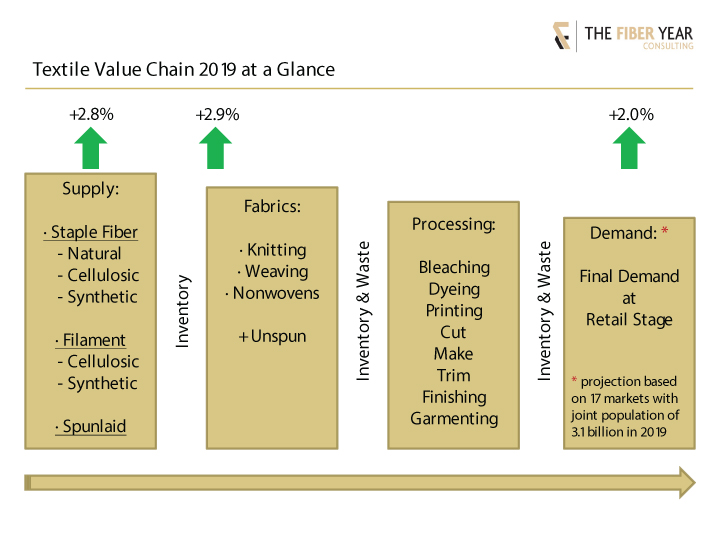
The third key figure refers to final end-use at retail stage. A global view is impossible, as full-year trade figures at that point of time are missing. The sample of 17 countries with a combined population of 3.1 billion last year includes lower, upper-middle and high income countries.
The next installment of “The Fiber Year” column will summarize textile and clothing trade data for 60 countries and provide selected data for the latest performance in early 2020. For more information about The Fiber Year report, visit thefiberyear.com.